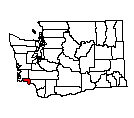
| Overview for Wahkiakum
County, WA |
|
|
 |
Wahkiakum County is
one of about 3,141 counties and county
equivalents in the United States. It has
264.2 sq. miles in land area and a
population density of 14.6 per square
mile. In the last three decades of the
1900s its population grew by 6.5%. On
the 2000 census form, 97.5% of the
population reported only one race, with
0.3% of these reporting
African-American. The population of this
county is 2.6% Hispanic (of any race).
The average household size is 2.42
persons compared to an average family
size of 2.83 persons.
In 2005 ag., forestry, fishing was
the largest of 20 major sectors. It had
an average wage per job of $34,947. Per
capita income grew by 14.3% between 1994
and 2004 (adjusted for inflation). |
People
& Income Overview
(By Place of Residence) |
Value |
Industry Overview (2005)
(By Place of Work) |
Value |
| Population
(2005) |
3,849 |
Covered
Employment |
825 |
| Growth
(%) since 1990 |
15.7% |
Average wage
per job |
$26,374 |
| Households
(2000) |
1,553 |
Manufacturing - % all jobs in County |
5.8% |
| Labor Force
(persons) (2005) |
1,712 |
Average wage
per job |
$33,411 |
|
Unemployment Rate (2005) |
7.0 |
Transportation & Warehousing - % all
jobs in County |
D |
| Per Capita
Personal Income (2004) |
$25,146 |
Average wage
per job |
D |
| Median
Household Income (2003) |
$40,353 |
Health
Care, Social Assist. - % all jobs in
County |
D |
| Poverty
Rate (2003) |
8.9 |
Average wage
per job |
D |
| H.S.
Diploma or More - % of Adults 25+ (2000) |
84.2 |
Finance and
Insurance - % all jobs in County |
1.7% |
| Bachelor's
Deg. or More - % of Adults 25+ (2000) |
14.8 |
Average wage
per job |
$25,139 |
|
|